Data, data, data: Applying Maths to 3Rs problems - a case study
In the final blog of the ‘Data, data, data’ series*, Dr Manasi Nandi, Senior Lecturer in Integrative Pharmacology at King’s College London talks about her project as a case study where mathematical modelling can help advance the 3Rs by improved analysis of cardiovascular data
How it all started
In 2013, the NC3Rs organised a Maths in Medicine Study Group which brought together mathematicians and in vivo biologists. The participants aimed to address particular questions that help to reduce or replace the use of animals in research, or make better use of the data generated in vivo.
My colleague Mark Christie and I presented a proposal focusing on whether more could be done with the large and complex datasets that are routinely collected by in vivo scientists, using monitoring techniques such as radiotelemetry.
Radiotelemetry and a sea of data
Radiotelemetry can be used to continuously monitor cardiovascular function, and is considered superior to techniques which require animals to be tethered, such as tail cuff and jacketed cannulation. Tethering restricts animal movement and can cause stress - which in turn, may increase heart rate and blood pressure. This can affect the data quality if you’re trying to monitor blood pressure and heart rate within your experiment, as it becomes difficult to separate the stress effects from the test drug effects, for example. When using radiotelemetry, blood pressure signals can be monitored remotely from animals that are free roaming in their home cages - minimising such stress responses, thereby reducing confounding factors, which in turn translates to more physiologically meaningful data.
The technique involves the surgical implantation (under general anaesthetic) of a small blood pressure monitor into a large blood vessel of the mouse. This is coupled to a radio-transmitter which is secured under the skin alongside the abdomen. Following recovery from surgery, the blood pressure of these freely moving animals can be monitored over days, weeks, months or even years.
Typically, the sampling frequency of these devices is 1,000 Hz, meaning that they capture 1,000 data points per second, which equates to 86,400,000 data points in one day! Data collection on this scale can fall under the category of so-called ‘big data’.
The problem with collecting such large data sets is that it can be very difficult to make sense of it – as Sydney Brenner (Nobel Prize in Physiology/Medicine 2002) said “we are drowning in a sea of data and starving for knowledge”1. The important thing is, of course, to use data in a scientifically meaningful, clinically useful and ethically responsible way.
Ready, steady, count!
During the NC3Rs workshop, 24 hours of mouse blood pressure data (from one animal) that had been collected by my lab was made available to all mathematicians who were interested in working on this problem. The aim was to use mathematics to look at the data differently and find new, creative ways of processing the data to ‘pull out’ the information that we can’t easily measure.
Over the next four days, shut away in rooms with laptops with occasional meal breaks, there was a flurry of activity from the mathematicians, who came from all over the world and represented all career levels from PhD students to professors. A number of different mathematical techniques were applied to try and make sense of the huge amount of data and extract more information from the large datasets.
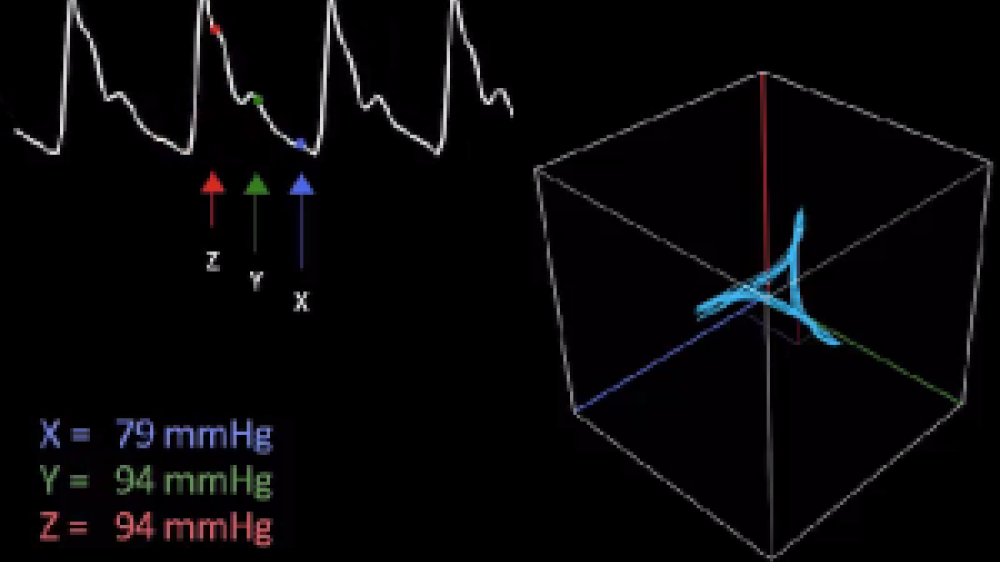
Professor Philip Aston (Department of Mathematics, University of Surrey) was also attending the NC3Rs event, with the hope of identifying new and interesting research projects to become involved with. He applied mathematical ideas from dynamical systems and chaos theory to our data. Using all of the blood pressure data which takes the shape of a periodic wave (a waveform), he took three equidistant points along the wave (see video and image, section 1) and plotted them against each other in 3D space (see image, section 2). When you repeat that for every point on the wave, you generate an ‘attractor’, a different representation of the data extracted from the original wave. This ‘attractor’ builds up a layer for every heart beat cycle, generating a 3D meshwork of all the raw data points in a cube (see video and image, sections 3-6).
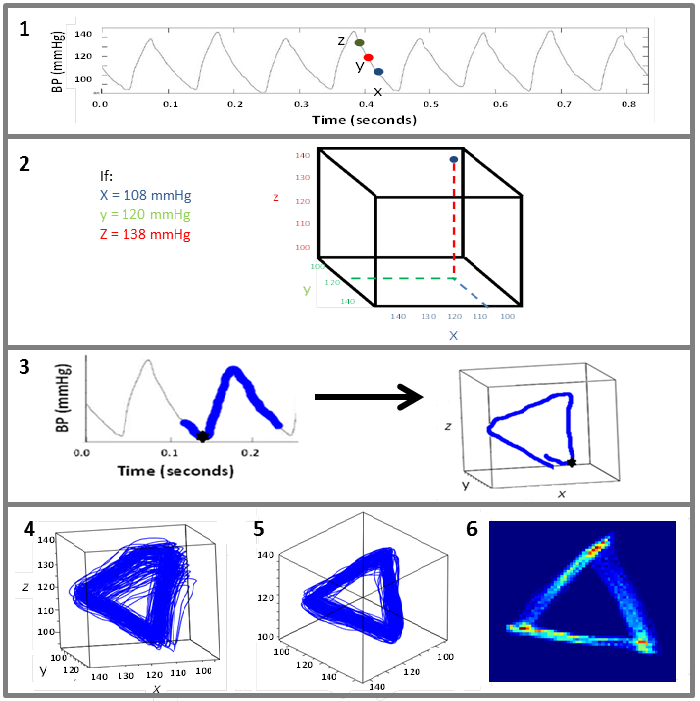
The mesh of replotted data was still rather noisy and difficult to quantify or extract meaningful biological measures from. Philip decided to see if this could be simplified by rotating the cube and viewing from one corner – which gave a more structured two-dimensional triangular shape. By applying this step, it was shown that various features of the resultant attractor directly correlated with changes in the shape of the waveform. By tracking through the whole dataset, the dynamic changes in the waveform were captured by dynamic changes in the attractor’s morphology.
Credit: http://ehealth.kcl.ac.uk/cardiomorph/
Maths and medicine
This realisation was particularly exciting because it has been known for many years that changes in the waveform shape may contain diagnostically useful information – but researchers don’t really have any robust techniques for the analysis with the large datasets that are currently collected. One of the earliest records highlighting the importance of waveform shape in understanding disease was written by Dr Frederick Mahomed in 18722,3. In those days, we didn’t have the technology to capture the numbers that describe these shape changes – but now, we do.
We are now applying this technique to try and determine if the attractor method can identify cardiovascular changes earlier and with more sensitivity than conventional measures of blood pressure such as the maximum or minimum pressure (systolic – maximum during the heart beat and diastolic – minimum in between two beats) or the number of heart beats in a minute (heart rate). One of the clinical areas of particular interest is septic shock.
Using data to diagnose sepsis quickly
My research is focused on cardiovascular dysfunction in sepsis which is a major problem in hospitals. It occurs when bacteria from an infection get into the bloodstream and trigger an exaggerated inflammatory immune response. This can cause the blood pressure to plummet, which in turn leads to insufficient oxygen delivery to organs; patients typically die of multiple organ failure. Sepsis is associated with 1 in 20 of all deaths and kills 44,000 people every year in the UK alone3,4. Strategies to identify septic patients sooner are needed, as the earlier the diagnosis and treatment, the more likely the patient is to survive.
So far, Philip and I have shown that the attractor method is more sensitive at detecting cardiovascular changes in the earliest stages of sepsis compared to conventional cardiovascular measures such as systolic/diastolic blood pressure or heart rate. These experiments involved using mouse models where the mouse is given a substance which induces the inflammatory response to infections.
As this is a mathematical method that only requires cardiovascular waveform data then it is easy to translate to human data and we have already demonstrated its use on healthy human volunteer data. This project is currently being translated into the clinical setting where we will be looking at archived patient data to see if we can predict impending clinical deterioration earlier. This would mean treatments would be brought on earlier and, in the setting of sepsis, this could be lifesaving.
Impacts of research on the 3Rs
Rodent studies of sepsis commonly rely on severe, end-stage models in an effort to recapitulate the multiple organ failure and death caused by late-stage sepsis in the clinic. There are a number of different surgical and non-surgical ways in which sepsis can be induced in these models, but all induce a significant inflammatory response and frequently require death as the endpoint. From a 3Rs perspective, we have shown that these new measurements (which describe the changes in the blood pressure waveform shape) could provide scientists with extra information that would tell them about the extent to which the syndrome has progressed and how quickly - it is not uncommon for the welfare of an animal suffering from sepsis to decline rapidly. This would mean that they could terminate their experiments earlier – meaning that the animal would not progress as far into the disease for future sepsis studies. This would represent a more humane endpoint to sepsis experiments.
This approach means we are able to make better use of animal data that has already been collected. In the last two years we have established numerous collaborations with academic and industry scientists who have given us access to their archived data sets to run in the model.
We are continuing to explore the application of our model in sepsis and other research areas where improved analysis of cardiovascular data would benefit the science and 3Rs.
*Other blogs in the series:
Data, data, data: The importance of measurement and the 3Rs
Data, data, data: How improving in vivo data management is good for the 3Rs
References
-
Brenner S 2003. Nature's gift to science. Nobel lecture, December 8, 2002. Biosci. Rep. 23, 225-237, 2003.
-
1872 The physiology and clinical use of the sphygmograph. Medical Times Gazette 1: 63,128, 220, 250, 340, 427, 569 and 2: 72, 143, 324
-
O'Rourke, Michael F. (1992). "Frederick Akbar Mahomed". Hypertension. American Heart Association. 19 (2): 212–217
-
McPherson D, Griffiths C, Williams M et al.2013. Sepsis-associated mortality in England: an analysis of multiple cause of death data from 2001 to 2010. BMJ Open 3:e002586. doi:10.1136/bmjopen-2013-002586