Improving the scientific quality of your enrichment study
Minimising the influence of bias and understanding the limitations of an evaluation.
Minimising the influence of bias
Bias occurs in research when an aspect of the methodology encourages one outcome or answer over other possibilities. Even the most experienced researchers can introduce subjective biases into a study. This is because biases can happen unconsciously, without someone being aware that they have occurred. Certain measures can be put in place to minimise bias. The text below gives some examples of where bias can occur throughout different stages of your study, how these could affect the study, and how they can be controlled for.
Selecting animals
- Potential bias: When selecting animals for experimental groups, choosing those animals that are slower and easier to catch or handle for the first group, and the remaining slower animals for the second group, could introduce bias.
- Example consequence: Any differences between the two experimental groups may only apply to the animals you selected. The slower animals could be bolder and more confident than their harder-to-catch cage mates, and they might respond to new enrichment in different ways, biasing your results.
- How to minimise bias: Incorporating randomisation into the allocation of animals to experimental groups, to minimise any difference between the animals in each group before the study starts.
Recording behaviour
- Potential bias: Recording behaviours in an inconsistent way and allowing pre-conceived ideas to influence how a behaviour is categorised.
- Example consequence: The dataset is unreliable and could lead to unsuitable enrichment being introduced to the animal facility.
- How to minimise bias: Testing observer consistency.
Analysing data
- Potential bias: Choosing to focus on certain results and figures that support pre-conceived ideas about what the results show. Not fully investigating data that contradicts these pre-conceived ideas.
- Example consequence: The results are subjective and do not show the full picture. Unsuitable enrichment is introduced, or enrichment that could have improved welfare is discounted.
- How to minimise bias: Masking (also known as blinding) during the data analysis step.
Interpreting results
- Potential bias: Choosing to attribute a finding to one explanation, when there are other possibilities that have not been explored.
- Example consequence: The conclusions may be incorrect, and an opportunity to investigate (and learn about) other possibilities is missed.
- How to minimise bias: Recognising and challenging assumptions. Actively discuss your findings with your colleagues and seek out alternative explanations for proper consideration.
Sharing results
- Potential bias: Sharing findings where enrichment has a positive effect, but not when enrichment has a negative effect or no effect at all.
- Example consequence: Studies are repeated because people are unaware that they have been conducted already.
- How to minimise bias: Share your results regardless of the outcome. There is really no such thing as a ‘negative result’ – if your study is robust and can be replicated, it is a success.
Randomisation
Within the example protocols, *Rand indicates opportunities to implement randomisation into your study.
Randomisation can be used to control for biases associated with selecting your study animals and allocating them to cages/tanks or experimental groups. The ‘Allocation’ section of the EDA (Experimental Design Assistant) contains information on simple randomisation procedures (e.g. flipping a coin, picking numbers out of a hat, or using the =RAND function in Excel). There are also free online tools and apps for creating randomised lists. This page focuses on using =RAND within Excel, however the steps could be easily applied to other methods of randomisation.
For the purpose of evaluating environmental enrichment you can use randomisation to:
- Select animals
- Select cages
- Create schedules
Selecting animals
Your protocol may require you to select animals to be moved to experimental cages/groups, or select an individual within a cage to focus on. Computer-generated randomisation tools can make this a simple task (e.g. www.random.org/lists). The =RAND function in Excel can also be used; instructions for this are given below:
- Ensure you can distinguish between the animals, either by marking them all or from their natural markings. If marking animals is necessary, use the most refined method possible.
- Assign each animal a number.
- Input all the animal numbers into Excel in a list, with each number on a new row.
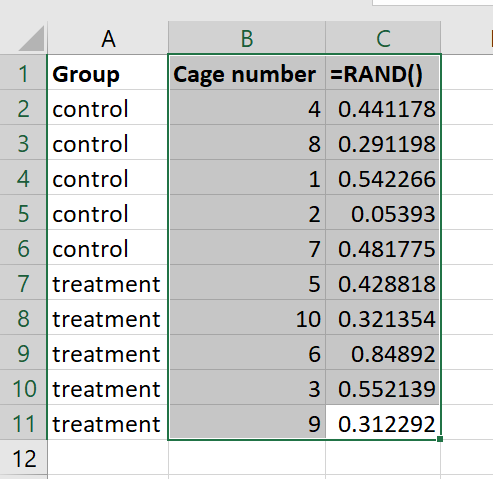
- In the column next to the animal numbers, type =RAND() and press enter. Ensure you include the brackets before pressing enter.
- This generates a random number between 0 and 1. Drag the corner of this cell down to fill the remaining cells with more random numbers. Each animal number should now have a random number alongside it in the next cell.
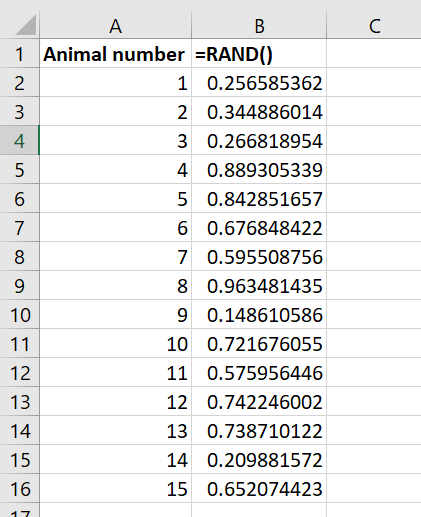
Step 5: generating random numbers in Excel using =RAND(). - Select both columns and use the SORT function (found under the data tab in Excel) to sort the numbers by the random number column, for example from the smallest to largest value.
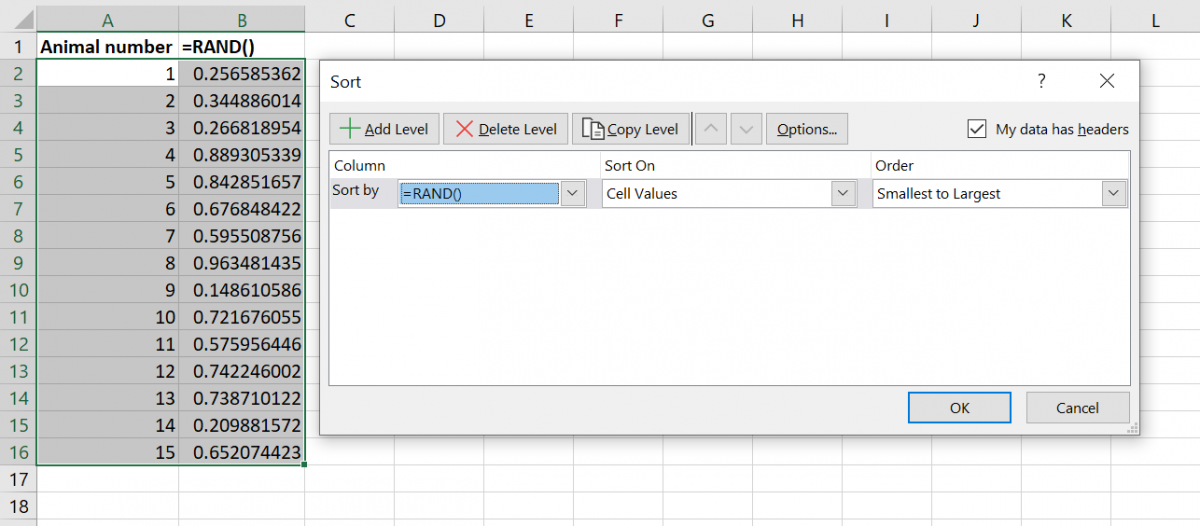
Step 6: using the SORT function to sort by the random number column, randomising the order of animal numbers. - The list of animal numbers is now randomised, and you can use the order in this list to allocate animals to different cages or treatments.
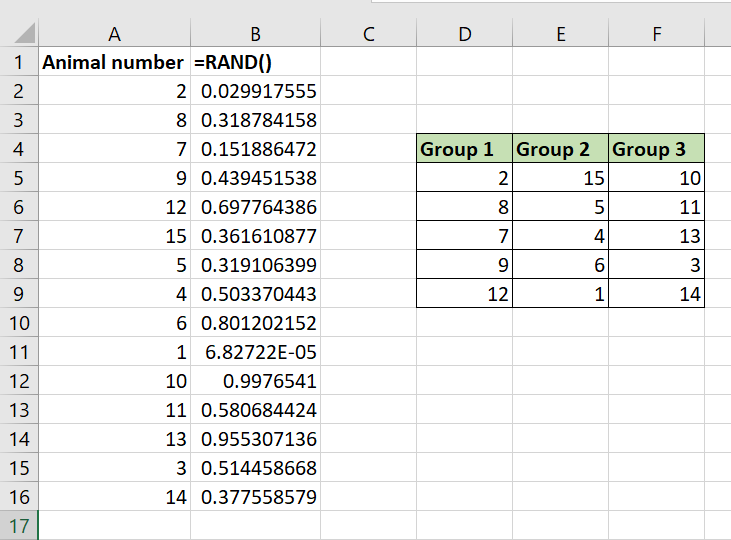
Step 7: the final randomised list of animal numbers.
Note that if you edit the spreadsheet, the numbers generated with =RAND will continue to change, but your animal number list is randomised as it is and does not need to be sorted again (unless you add further animals to the list).
Selecting cages
The above method can also be used to select cages or tanks. The study protocol may require this if you are observing animals in their home setting or allocating different cages to different experimental groups. Enter all the cage numbers into Excel, create a =RAND column and sort the lists using the randomly generated numbers, as outlined for selecting animals.
How you then choose to select the cages from the list depends on how many you require for your study. For example, you may have 100 cages that could potentially be selected for your study, however you are only planning to use twenty, ten experimental cages and ten control cages. If this were the case, you would select the first twenty cages after the list is sorted, assigning the first ten to an experimental group and the next ten to the control group.
Creating schedules
Randomisation can also be incorporated into your experimental schedule to determine the order you carry out your observations. This can prevent the animals anticipating the observation period and control for any other factors that might arise from repeatedly observing animals or cages in the same order (e.g. the circadian rhythms of the animals, or the energy levels – or fatigue – of the observer).
The following steps provide guidance for creating a schedule for observing ten cages (five control, and five containing a new enrichment item) with one observation made in the morning and one in the afternoon. This is an example and should be modified to meet your own requirements.
Allocate your cages/animals to groups
1. Input a ‘group’ list of indicating the number of control and treatment cages to be used in your evaluation (e.g. five control and five treatment).
2. Input a list of cage numbers in the next column (e.g. 1 – 10).
3. In the third column, create a list of random numbers using the =RAND function (see selecting animals for detailed guidance on using =RAND).
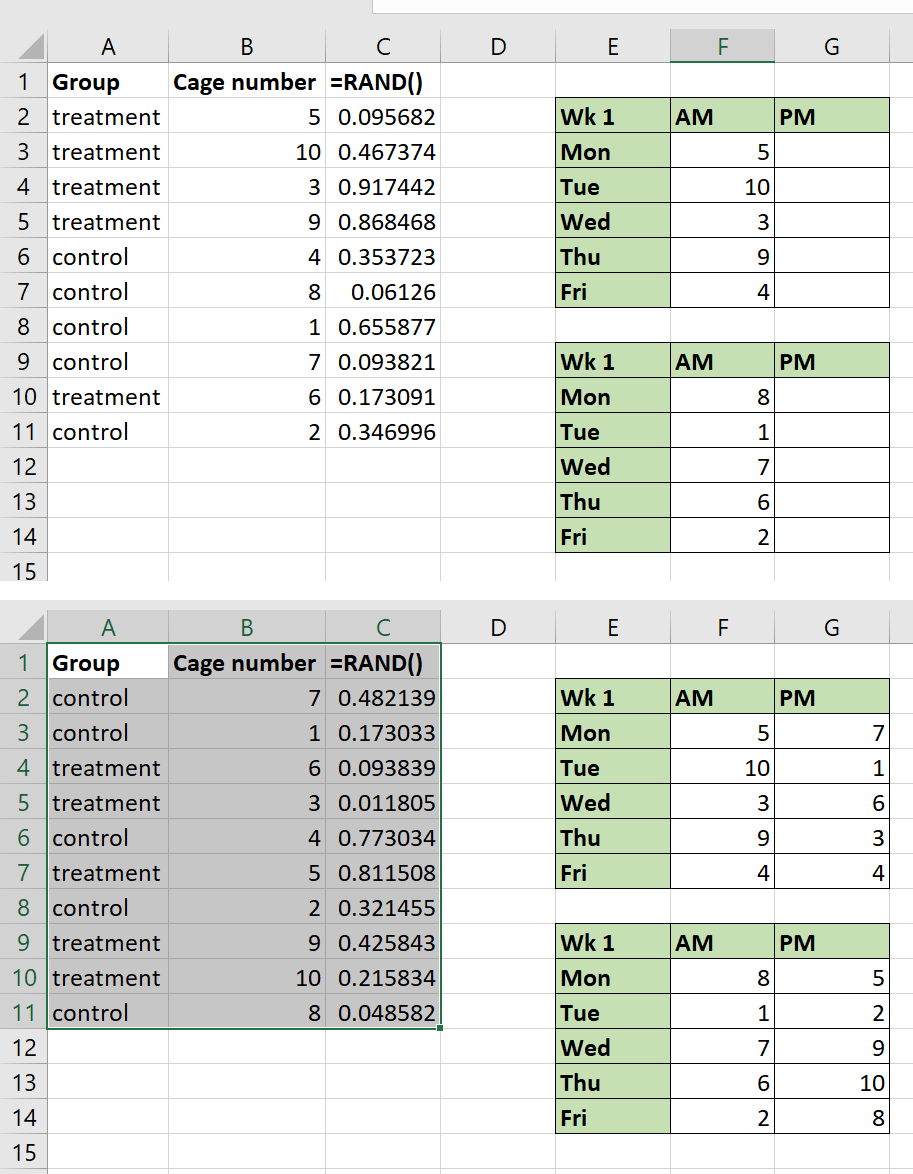
4. Select only the cage numbers (Column B) and the list of random numbers (Column C). Leave the group column (Column A) unselected.
5. Sort the cage numbers (Column B) by the list of random numbers (Column C). This will randomly allocate the cage numbers to either a control or treatment group.
Allocate your cages/animals to slots in your schedule
6. Now select all three columns and sort by the =RAND column (Column C).
7. The cage numbers will now be in a random order. Copy this order into the morning slots of your table.
8. Repeat steps 6 – 7 to randomly allocate cages to the afternoon slots.
Masking (blinding)
In the context of evaluating enrichment, masking (also known as blinding) is where someone who is part of the study does not have all the information on which animals have been exposed to which types of enrichment. Masking/blinding may be possible during:
- Data collection
- Data analysis
Data collection
If the differences in enrichment are obvious to the naked eye it may not be possible to incorporate masking into the data collection stage. However, it could be possible in some circumstances.
Example 1
Riya and Lee are collecting data on waterflow and structural enrichment for zebrafish using video recording equipment. The tanks are divided into two compartments, both containing identical structural enrichment items arranged in the same way. A water pump is set to create a gentle current within one compartment in each tank. The number of fish in each compartment is counted every five minutes to determine whether the zebrafish prefer swimming in a current when structural enrichment is provided.
Riya has used randomisation to assign the pump to the left or right compartment of each tank. There are an equal number of pumps within the left and right compartments. She has made sure the pump is not visible to the camera and she has not told Lee where the pumps are.
Lee watches the video recordings in a randomised order and records the behavioural data while masked to the position of the water pumps.
Example 2
Pat is carrying out an evaluation to see whether rats prefer to gnaw on apple or cherry-flavoured chew blocks, which are identical in appearance. Pat will score the blocks on how gnawed they appear.
Hana helps Pat out by randomly assigning the two flavours to the cages of rats. Hana knows which cages have received which flavour chew, but Pat does not (i.e. Pat is masked). Pat will collect the data and can evaluate how gnawed the chew blocks are, while remaining masked to which flavour is which.
Data analysis
Masking can easily be incorporated into data analysis. A person who is not involved with actual data analysis removes the information that identifies the different experimental groups, replacing it with simple codes.
For example, Sally and Irena conduct a preference test to see whether their animals prefer one shelter type over another. Before sending the data over to Daniel to analyse, they replace any reference to the shelter type with the numbers 1 and 2. They make a note of which number corresponds to which type of shelter, so that they do not forget, but they do not share this information with Daniel until the data analyses are complete (i.e. Daniel is masked).
You can learn more about blinding in the EDA (Experimental Design Assistant) and the resource page on Using masking/blinding in in vivo experiments.
Testing observer consistency
To have confidence in your findings, it is important that data collection – within and between observers – takes place in a consistent and objective way. It can be easy to stray from the rules without realising it. To guard against this, consistency tests should be carried out before beginning data collections and then throughout the study period.
Well-defined categories for behaviour should result in at least 9 out of 10 (90%) observations being the same. If this is not the case, then it will be necessary to revisit how you have defined behaviours in your ethogram and/or practice recording behaviours before you continue with more data collection.
Checking consistency at the cage-side
Enlist a colleague to sit with you during observations and record behaviours alongside you. This colleague should be briefed on what you are recording and how; ideally, they will also be involved in the project to evaluate enrichment. Your colleague can just record a subset of the behaviours, for a set period, but they should stay still and quiet for the whole observation period so as not to disturb the animals.
Compare what you have both recorded about the behaviours the animals performed. Is it the same? If so, why not? Is a wider discussion with everyone involved in data collection required?
Checking consistency using video recordings
The method shown above, for cage-side observations, can also be followed for behaviour that has been recorded onto video. However, a greater number of people can record behaviour from the same video, and they can do this whenever it fits into their schedule. This may be the most convenient option, especially when working with a larger team.
If you are working alone, you can record data from the same video repeatedly, keep your data collection sheets and compare them to see if you are consistently recording behaviours in the same way.
Whether you are working alone or in a group, scoring behaviours from a recording can be used as practice before beginning a study.
Recognising and challenging assumptions
To a certain degree, everyone will have preconceived ideas or assumptions about the motivation, preferences and behavioural of animals in general. For an objective study, it is important to keep an open mind when interpreting results and to explore different explanations fully. Examples of steps to achieve this are:
- Consider what your own point of view is and maintain an awareness that you might be biased towards information that confirms what you already think.
- Actively search for alternative explanations and try to prove them. Look in published literature, ask a colleague to challenge you, or imagine how you would argue against yourself.
- Get together in a group, list all possible interpretations, and write down everyone’s suggestions. Go through the list together and consider ‘for and against’ for each one.
Understanding the limitations of an evaluation
There are many constraints on animal technicians who wish to carry out evaluations of enrichment; for example, restricted access to animals may result in small sample sizes. This is a common example of something that could be considered a limitation of a study.
If you become aware of a limitation of your own evaluation, don’t be disheartened – it is positive that you were able to recognise it! It is also the case that all studies (regardless of who has conducted them) have some form of limitation, although some flaws can result in more unreliable data than others. It is important to acknowledge and be open about limitations, and – if it is necessary and feasible – you can address these flaws to improve confidence in your findings.
The example below outlines how some potential limitations of enrichment evaluations can be addressed.
Example
Freya carried out an evaluation of a designated digging box for rats. Every day for a month the rats were picked up and carried to the digging box, spending a set amount of time exploring and digging. The rats were then picked up again and returned to their cages.
Colleagues reported that the rats were calmer during procedures at the end of the month, compared to before they had access to a digging box.
Freya thinks this is because of access to enrichment. However, her colleague has challenged this, suggesting that the rats may be calmer as they have become more used to being handled, and are therefore less stressed when they are picked up for procedures.
Examples of how this evaluation could be improved
Including a control group of rats that are handled but do not have access to the digging box.
The control animals would be handled as frequently as the rats who used the digging box and a comparison could be made between the two groups. As both groups would have had equal opportunity to become habituated to handling, Freya could be more confident in her conclusion that the change in behaviour was due to the digging boxes.
Implementing a consistent scoring system to record ease of handling would allow data to be collected in a methodical way (rather than just relying on memory, for example). A discussion could then be had with her colleagues about how behaviour will be recorded consistently by different people. These steps will give Freya more confidence in quality of data that is collected.
Incorporating masking so that her colleagues were unaware of which rats were part of which treatment (control or digging box) would prevent their opinions (or unconscious biases) on enrichment influencing how they perceive the rats’ behaviour. By withholding information on which rats used the digging box, Freya can be more confident that a change in behaviour has occurred.
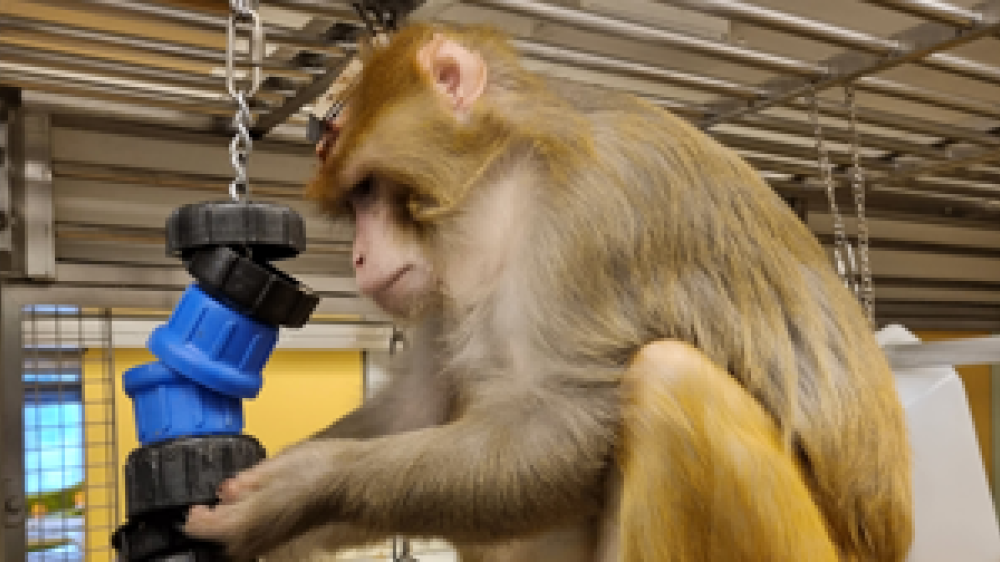
Using what you have learned to benefit the animals in your care and disseminating your findings. (Image credit: University of Cambridge.)