Funding scheme outputs
Background
We use the Researchfish platform to gather information on the outcomes and impacts that arise from the research and early career awards we fund. The data allows us to monitor progress and identify trends as well as providing information we can use in case studies, corporate reports and funding bids.
NC3Rs grant holders report outputs into Researchfish that have resulted from, or are directly linked to, their awards. Researchfish is open to researchers all year round, but there is an annual submission period when researchers are asked to confirm their information is accurate and up to date. All NC3Rs grant holders are required to submit a report during the submission period for each year of their grant and typically for five years following the grant’s completion.
The most recent Researchfish submission period ran from 6 February 2023 to 16 March 2023. We had 439 awards (excluding CRACK IT Challenges contracts) on the Researchfish system, of these 233 were expected to submit in the 2023 submission period. In practice data from 341 grants from 283 grant holders was submitted, representing approximately £60.2M of awards. In this report we summarise the 2023 data collection, including data reported on 3Rs impacts, publications, further funding secured and examples of policy influences and engagement activities.
There are a number of points to note:
- We have collected data via Researchfish annually since 2013 and in 2017 3Rs impacts were included as an additional question set. Some grant holders with awards that pre-date this have chosen to use Researchfish, where this data has been submitted it has been included in analysis, although the dataset is not complete.
- The data submitted to Researchfish is ‘cleaned’ by the NC3Rs team liaising with grant holders where necessary to check for accuracy, completeness and avoid duplication of data.
- Each graph includes an ‘n’ number, which indicates the total sample presented in the graph. Differences between header statements (in highlighted boxes) and graph ‘n’ numbers are due to incomplete data for some of the categories of information presented in graphs. 0% indicates a value less than 1% that has been rounded down during analysis.
- All averages have been calculated as the mean of data between 2013 and 2022 only as this is the period we have a complete set of reported Researchfish data.
Researchfish data summary
Figure 1 shows the number of grants reporting a 3Rs impact. A number of the grants that have not reported 3Rs impacts are active awards, with 15 of these grants starting in the 12 months before the submission period.
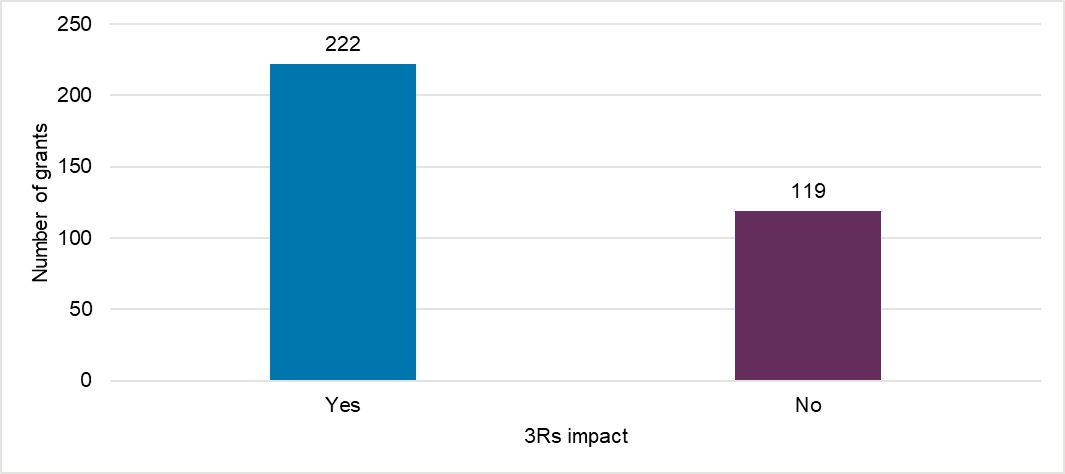
Figure 2 shows the breakdown by ‘R’ of those grants that report a 3Rs impact.
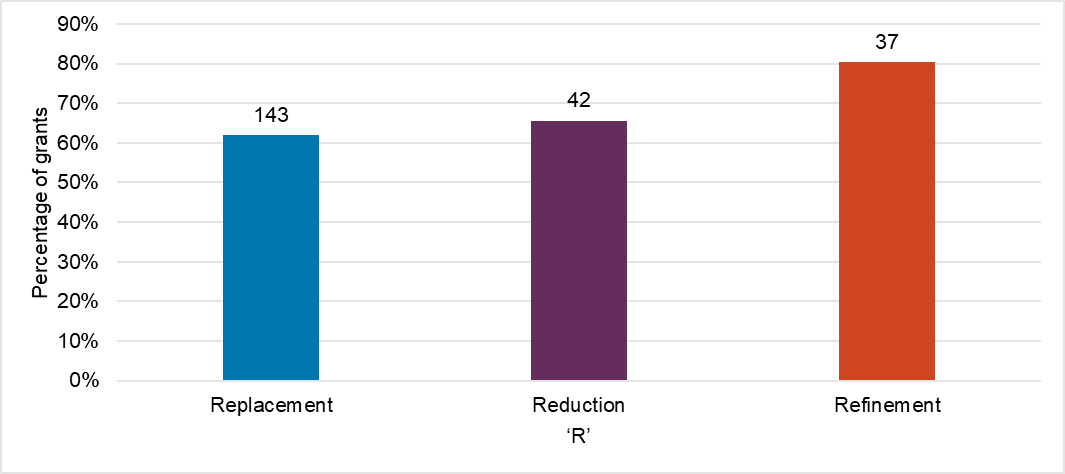
Figure 3 shows the percentage of awards by ‘R’ where the grant holder has reported a 3Rs impact in their own laboratory.
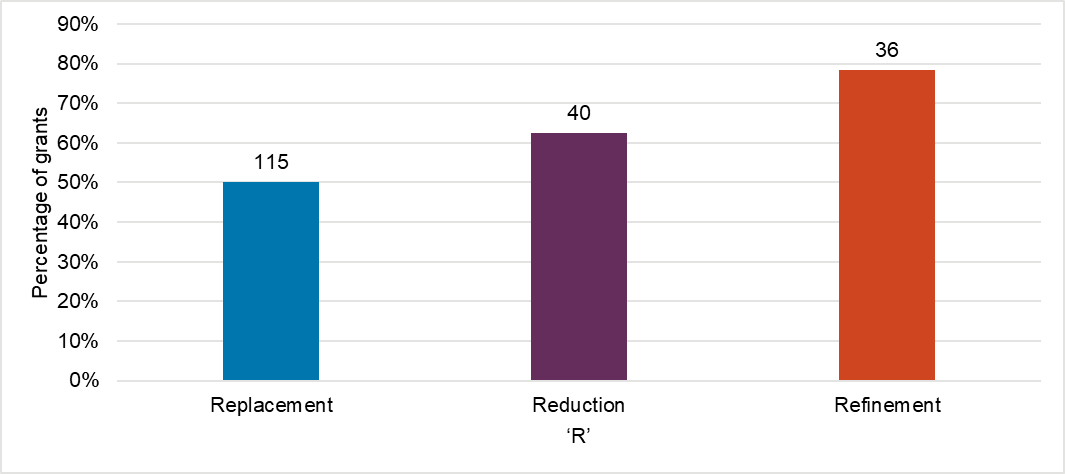
Figure 4 shows the percentage of awards which included the development of a method, tool or technology including further development of existing models.[1]
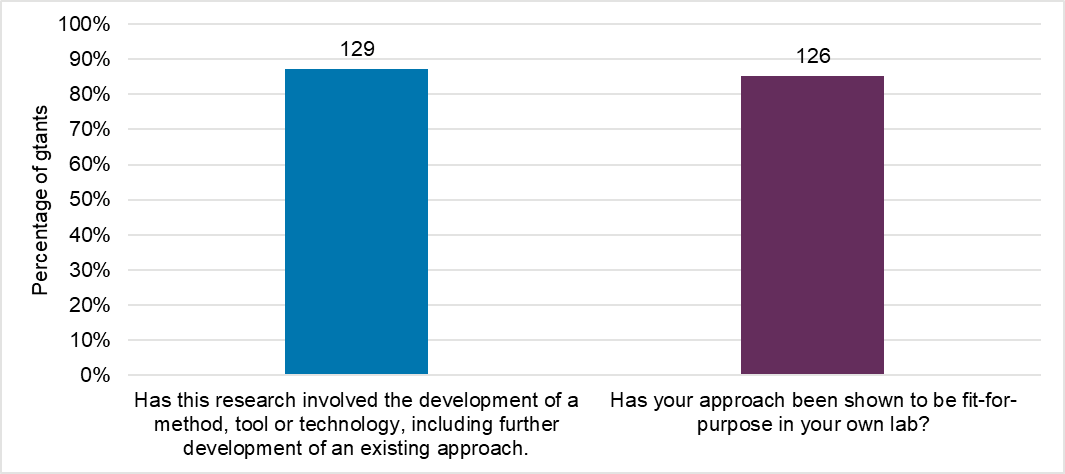
Figure 5 shows the percentage of awards where the 3Rs approach developed has been validated or used by another laboratory.
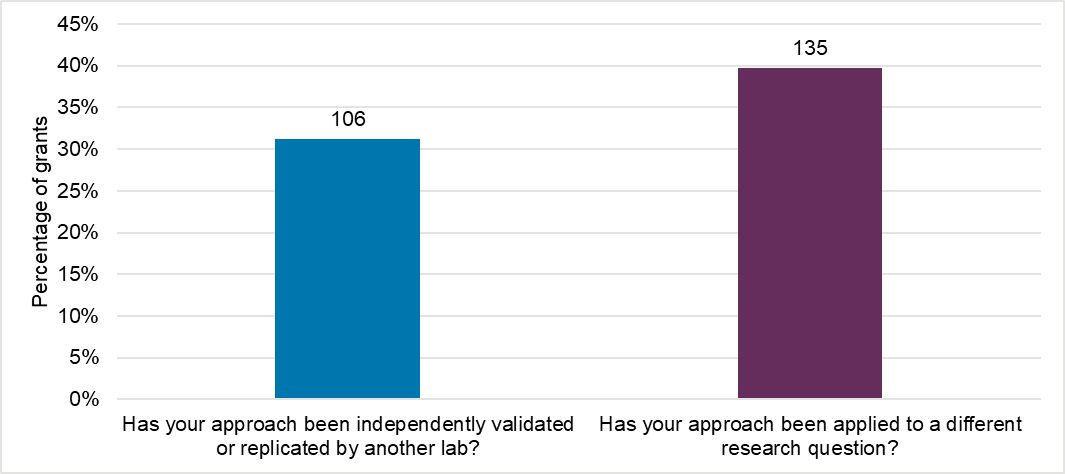
Figure 6 shows the percentage of grants by ‘R’ that have led to the 3Rs approaches developed being used in laboratories nationally or internationally (i.e. beyond that of the grant holder).
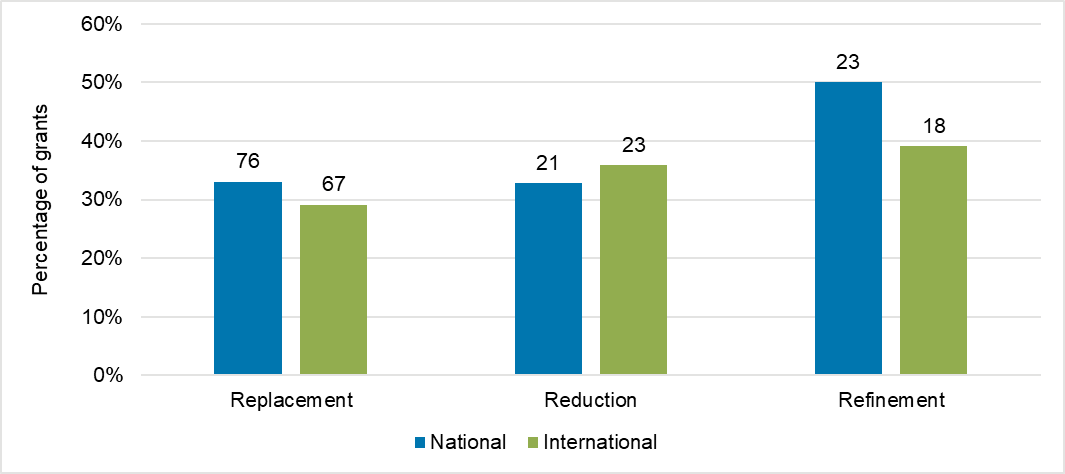
Figure 7 shows the types of research materials developed and the relative proportions.
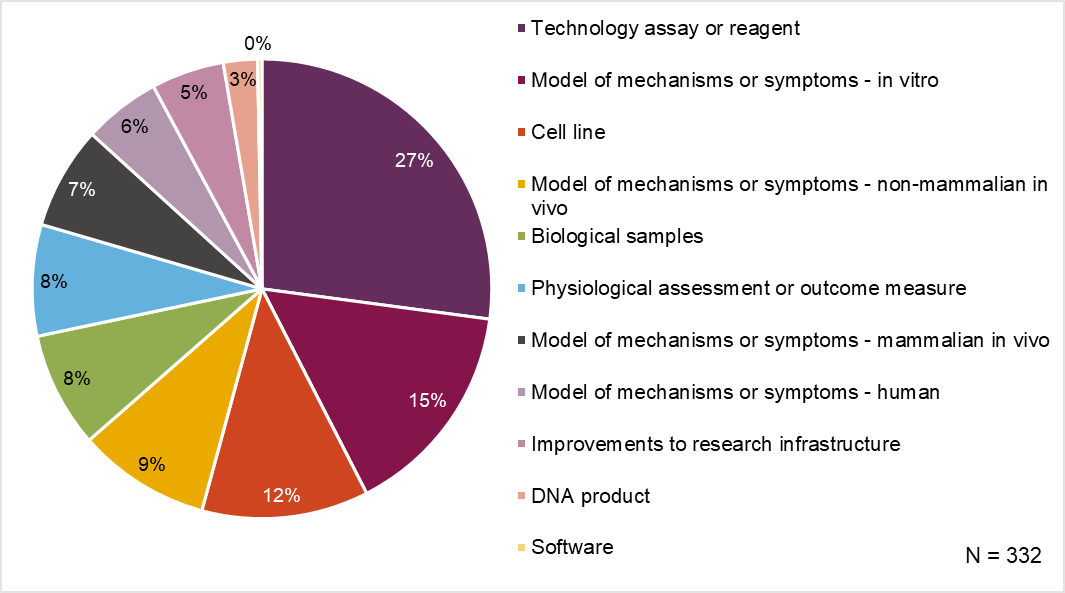
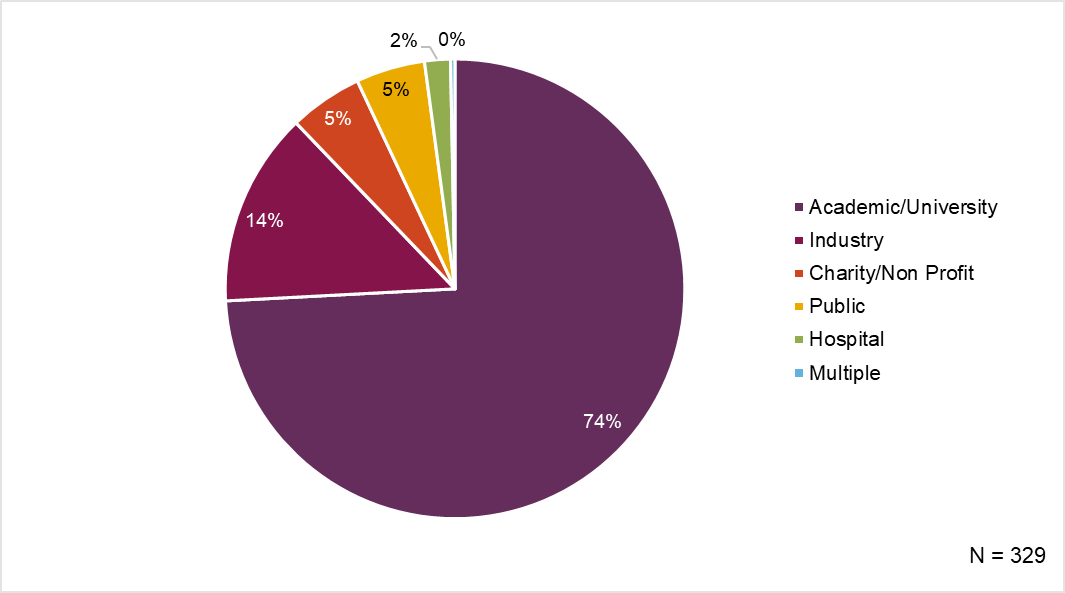
Figure 8 shows the sectors with which NC3Rs grant holders report collaborations with. Note 84% of all collaborations were reported as active collaborations at the time of Researchfish submission (data not shown).
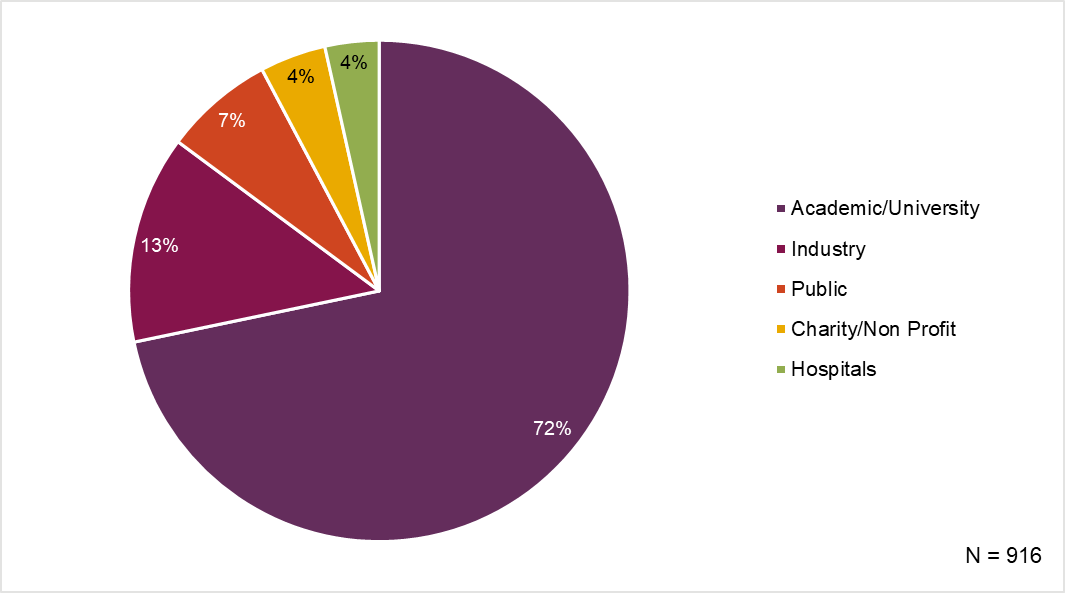
Figure 9 shows the number of publications arising from NC3Rs grants from the start of the award. Note the average time taken for an NC3Rs grant holder to report a publication is three years after their grant begins (data not shown).
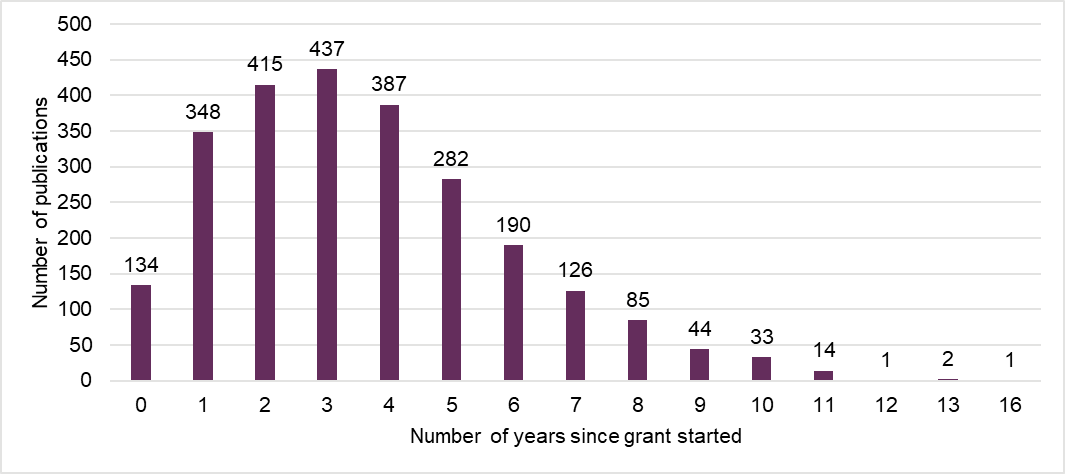
Figure 10 shows the types of journal articles published by NC3Rs grant holders and the relative proportions by article type.
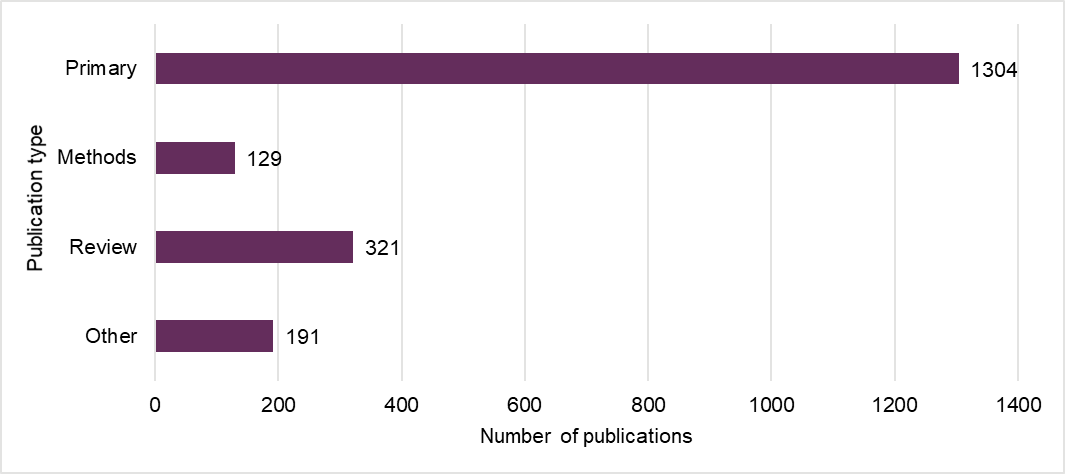
Figure 11 shows the length of time it takes for NC3Rs grant holders to secure further funding after their NC3Rs award has started. Further funding secured in the same year as the NC3Rs grant starts is marked as 0 years.
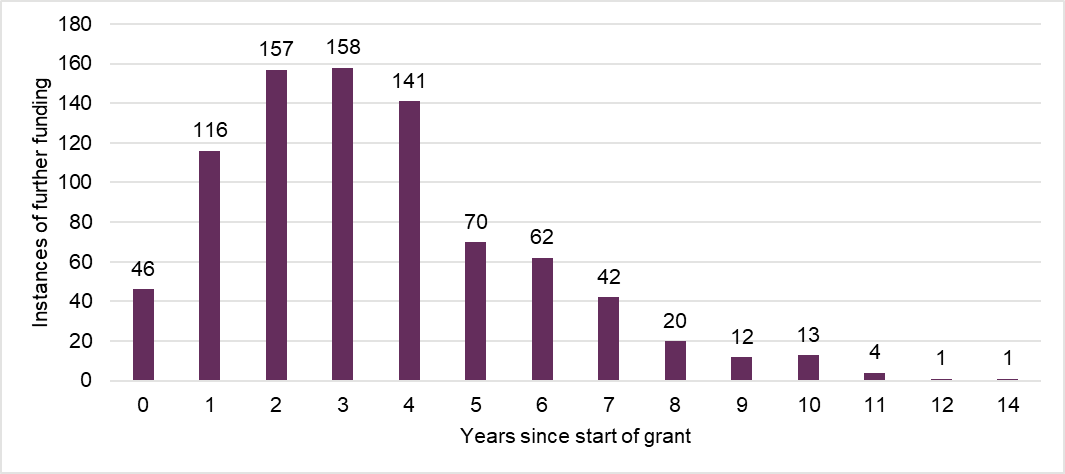
Figure 12 shows the types of further funding secured by NC3Rs grant holders and the relative proportions by grant type.
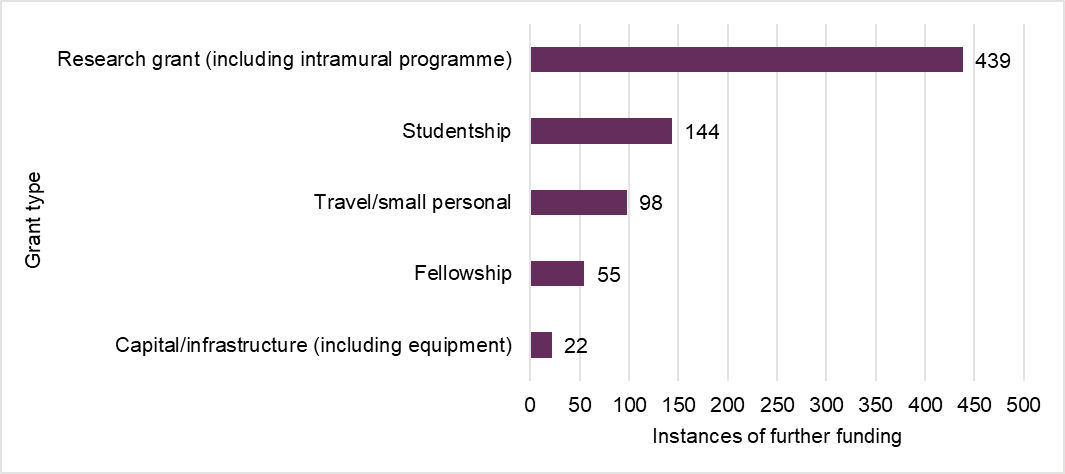
Figure 13 shows the sectors from which investment is secured by NC3Rs grant holders and the relative breakdown.
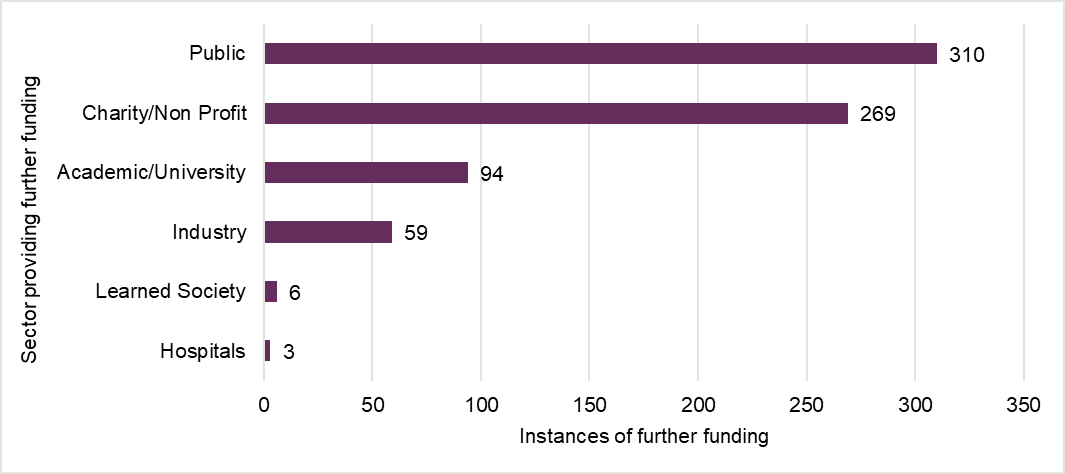
Figure 14 shows the amount of further funding received by NC3Rs grant holders.
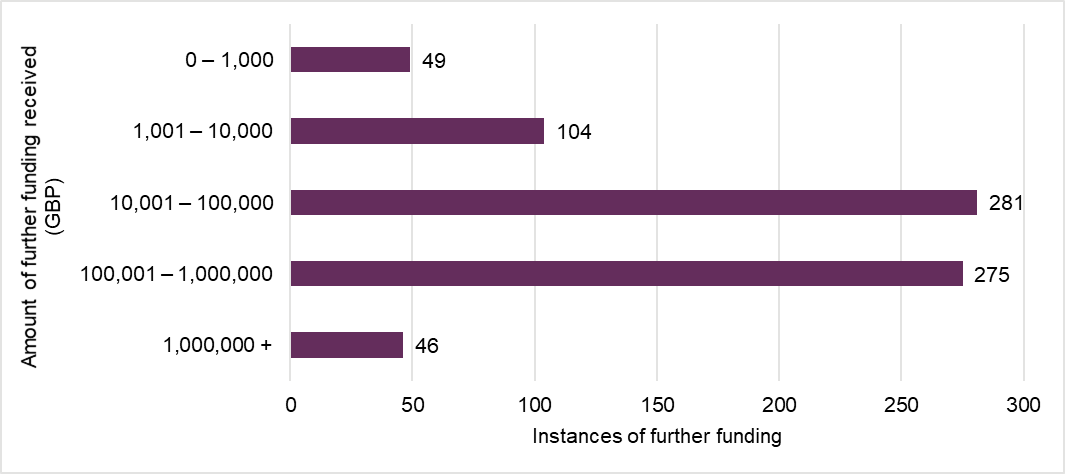
Table 1 shows the spin-out companies established as a result of NC3Rs research funding.
| Company | Year established |
|---|---|
|
Destina Genomics |
2010 |
|
SimOmics |
2013 |
|
Xenobics |
2014 |
|
Neuralixer |
2014 |
|
Renovos Biologics Limited |
2017 |
|
Bioflares Ltd |
2021 |
|
Science Engineered Limited |
2022 |
|
Theragenix Ltd |
2022 |
|
Peptimatrix |
2023 |
Figure 15 shows the types of policy influences that NC3Rs grant holders have had and the relative breakdown by policy types.
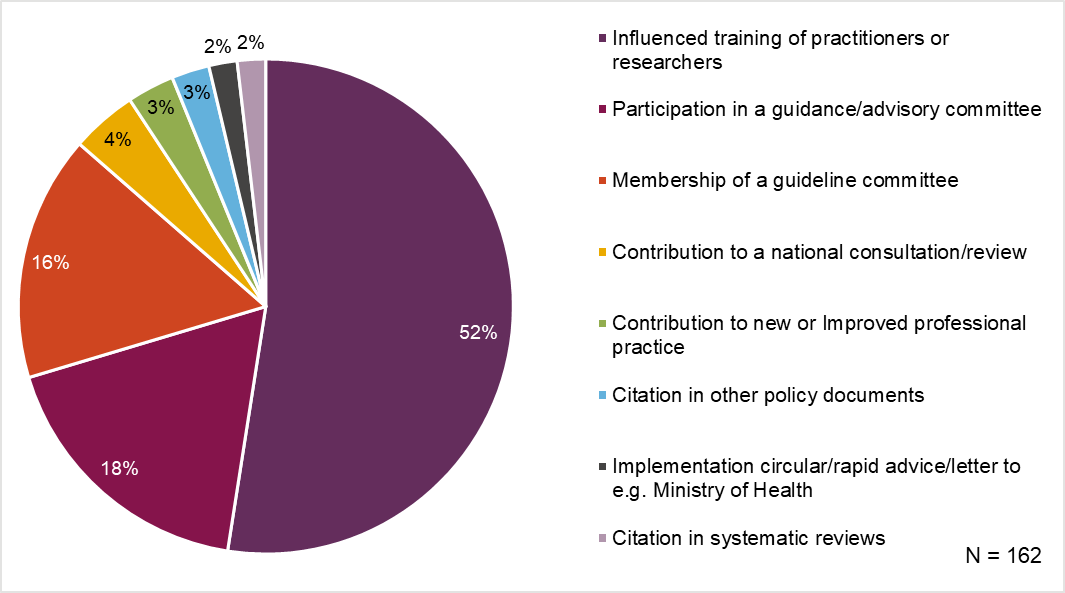
Figure 16 shows the types of engagement activities performed by NC3Rs grant holders and the relative breakdown by activity type.
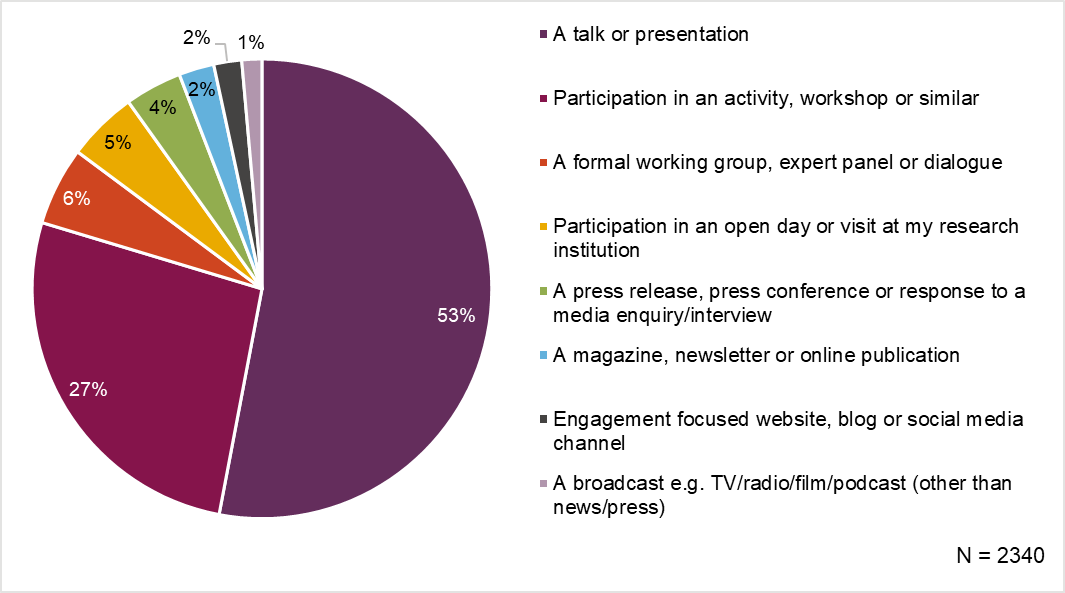
Figure 17 shows the reach of the engagement activities by NC3Rs grant holders reported by geographical location from local to international.
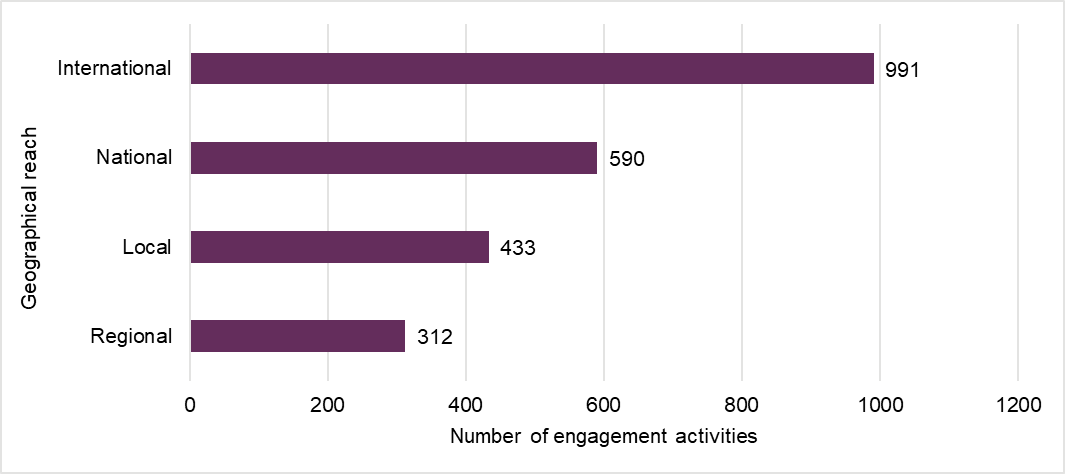
Figure 18 shows the audience size of reported engagement activities.
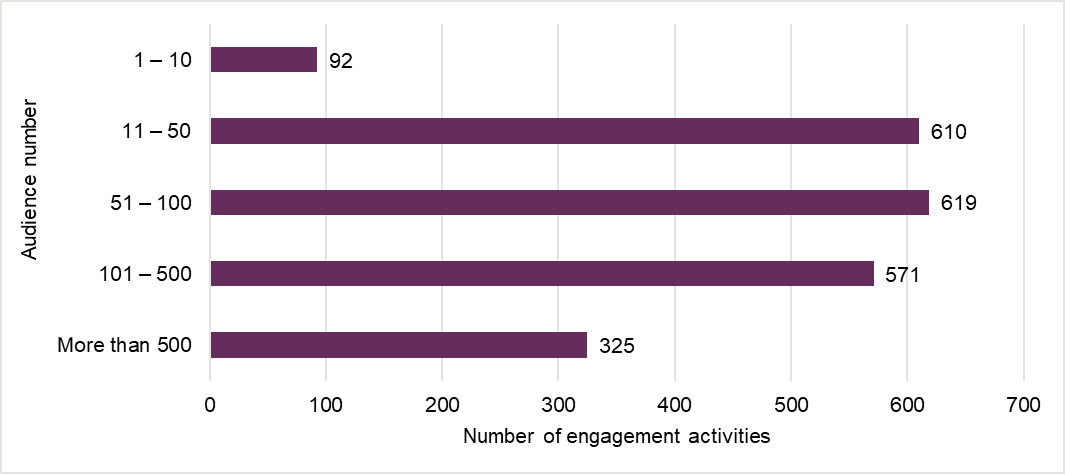
Figure 19 shows the audiences reached through the engagement activities described in Figure 15, with the relative breakdown by audience type.
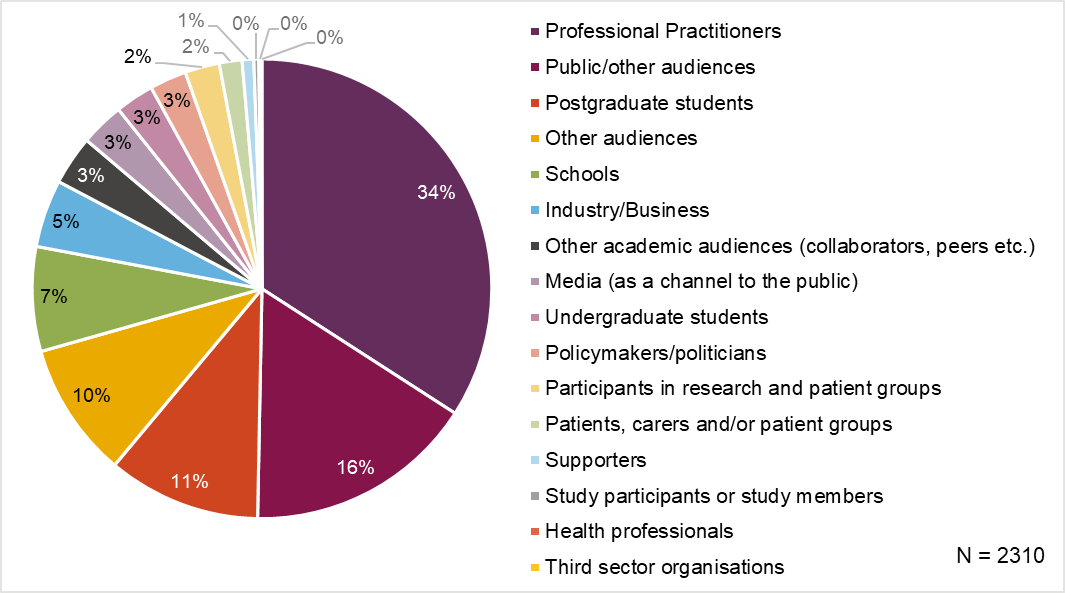
Figure 20 shows the personal awards and types of recognition that NC3Rs grant holders have reported, with a breakdown by type.
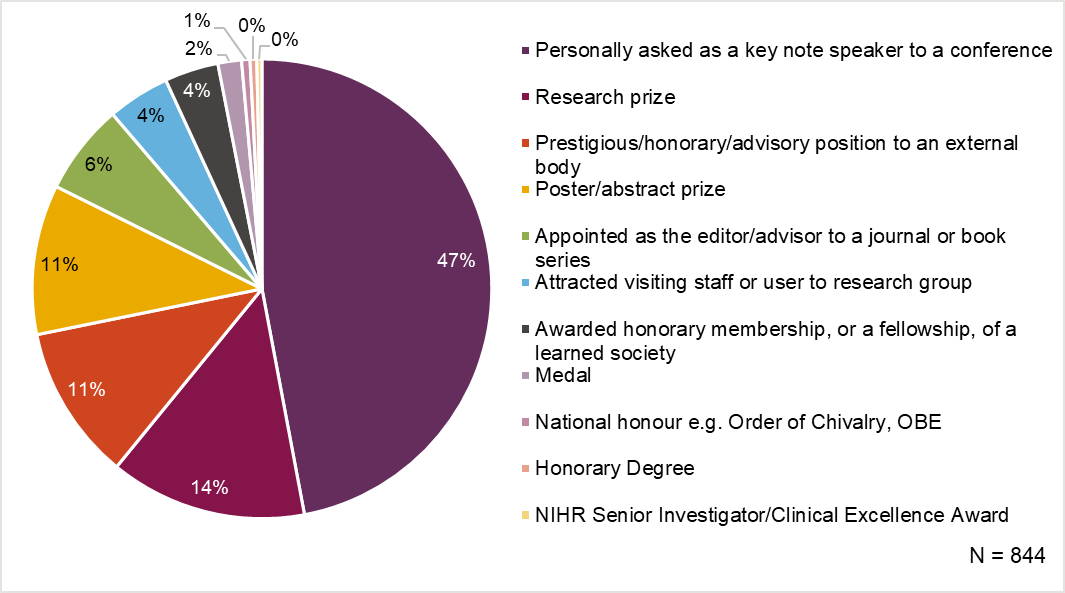
Figure 21 shows the next destination of people who change position during, or after, an NC3Rs award with a breakdown by sector.
[1] Due to an error with Researchfish collection, this dataset contains responses from 148 grant holders only.
Enquiries
If you have any questions, comments or feedback on this report please contact the NC3Rs funding team.